Knowing a patient’s oxygen levels provides crucial information about their respiratory status. Did you know, though, that measuring the carbon dioxide they exhale is often just as important? You can read this vital sign with a device called a capnograph, which produces a waveform diagram much like an EKG.
Capnography waveforms can give you information on anything from whether your airway placement was successful to whether a patient suffered respiratory damage. As such, these devices are as valuable for triage as they are for long-term monitoring.
Want to learn how to track a patient’s ventilation on your own? In need of a capnography waveform cheat sheet? In this guide, we’ll teach you how to read a capnography monitor and interpret the results.
Introduction to Capnography Waveforms
 Capnography measures ventilation through a metric known as end-tidal carbon dioxide (EtCO2). EtCO2 values are recorded in mm Hg (millimeters of mercury), a unit of pressure. The normal values for patients regardless of age, sex, race, or size range between 35-45 mm Hg, or about 5% CO2.
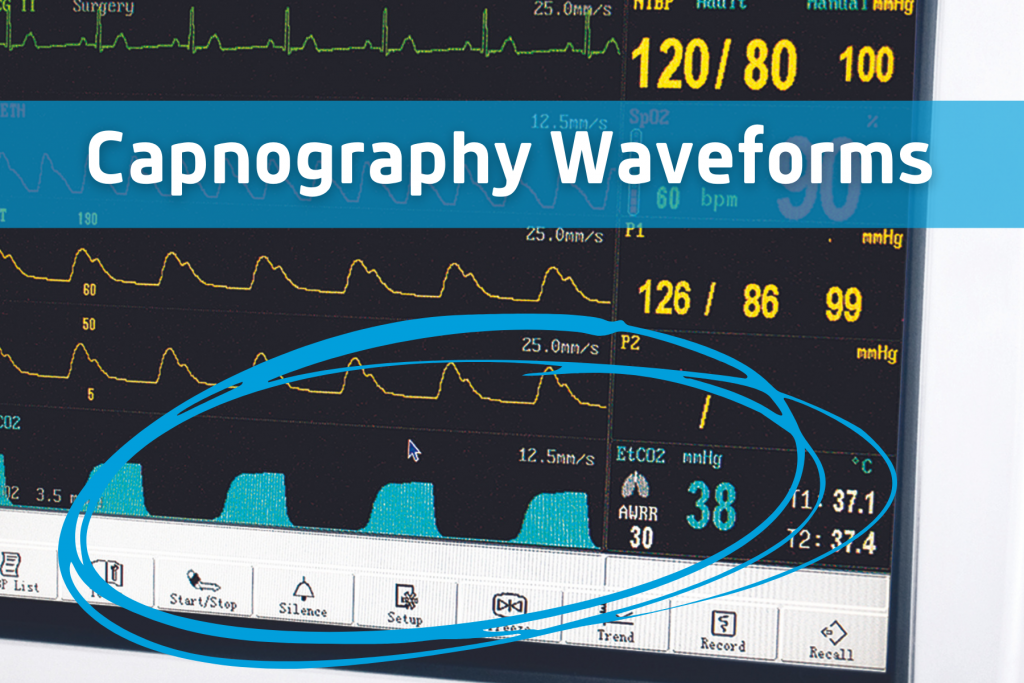
When you look at a waveform diagram, you’ll notice that the vertical axis measures the EtCo2 value. The horizontal axis shows the time elapsed.
A live capnography display scrolls in real-time and is often unlabeled. In this case, the exact EtCO2 value will be shown elsewhere on the screen. You’ll use the waveform shape to interpret general ventilation patterns.
The end-tidal CO2 monitoring standard of care varies based on your environment and the situation—paramedics in the field, for example, may use slightly different methods than anesthesiologists in an OR. Even so, you can read the waveforms displayed on a capnography device the same way no matter what machine is used or what condition the patient is in.
The Capnography Alphabet
When you’re learning to read an EtCO2 waveform, it’s best to start with the alphabet. The letters PQRST will help you remember what you’re watching for when looking at a waveform: proper, quantity, rate, shape and trend.
- Proper: what are the normal or “proper” readings we’re looking for?
- Quantity: what is the patient’s EtCO2, and is it within the normal range?
- Rate: how fast is the patient breathing, is it within the normal range, and is the rate changing?
- Shape: does the waveform display the typical shape or one associated with a specific problem?
- Trend: is the patient’s ventilation improving, stabilized, or worsening?
Keep these letters in mind as we move on to look at the different phases of a capnography waveform.
Capnography Waveform Phases
Capnography waveforms may look difficult to read, but once you understand what they’re trying to tell you, you’ll find that it’s fairly simple. They’re nothing more than a type of line graph that illustrates a patient’s breathing pattern.
The part that takes getting used to is reading the graph in terms of how much carbon dioxide is present instead of oxygen. When the patient exhales, the line goes up. When they inhale, it falls toward zero.
Every waveform displays four distinct phases of ventilation. When someone is breathing normally, these take the shape of a rectangle with rounded corners.
Phase I
The first phase of a waveform takes place during inhalation. Since you don’t release carbon dioxide while breathing in, this phase is a flat line at or very close to zero (the horizontal axis). Phase I forms the baseline of your waveform.
Phase II
Phase II begins at the point where your patient transitions from inhaling to exhaling. The rapid increase in CO2 pressure trips the capnograph’s sensors. This appears as a sudden uptick in the graph, forming the first side of the rectangle.
Phase III
Which phase of the capnography waveform represents dead space air being exhaled? That would be phase III, also called the alveolar plateau.
Phase III forms the top of the waveform rectangle. It should maintain a mostly constant pressure between 35-45 mm hg as your patient breathes out. The peak pressure at the very end of the plateau is your end-tidal carbon dioxide value.
Phase IV
Phase IV takes place when your patient transitions from exhaling to inhaling. Remember that CO2 isn’t released during inspiration. As such, phase IV appears as a sharp drop from the end-tidal CO2 peak back down to baseline, forming the last side of the rectangle.
Abnormal Capnography Waveforms and Their Interpretation
Knowing how to read capnography waveforms gives you a surface understanding of your patient’s ventilation status. However, learning how to interpret the data you read can also tell you about their perfusion, metabolic status, and any abnormal respiratory states.
As an example, let’s go over a few common respiratory problems and how to identify them on a waveform.
Hypoventilation
Slow and/or inadequate breathing leads to a buildup of carbon dioxide in the body. A person who is hypoventilating will have an end-tidal carbon dioxide value above 45 mm Hg. You’ll also notice that their waveform rectangles appear stretched out due to the longer time between breaths.
Hyperventilation
If your patient is breathing at a rate above 20 breaths per minute, they’re eliminating a lot more CO2 than average. This excess elimination results in a decreased concentration of carbon dioxide in the body.
A typical capnography waveform for hyperventilation will still have a close to normal shape. The standout feature is an EtCO2 that’s far lower than thy typical 35 mm Hg. You’ll also notice that the rectangles are smaller than normal due to the shorter time between breaths.
The potential reasons you might see this waveform include metabolic acidosis, anxiety or panic attacks, and even rapid manual ventilation with an artificial airway or bag-valve mask.
Obstructive Respiratory Conditions
Some patients in respiratory distress will produce a waveform that’s almost the normal shape, but has a more significant upward slope during phase III. Instead of the regular plateau, you’ll see a shape that looks quite a bit like a shark’s fin.
This “shark fin” pattern is typical of chronic obstructive respiratory diseases like asthma, emphysema, and COPD. When air gets trapped in the lungs as the patient struggles to exhale, it often results in a buildup of carbon dioxide and an EtCO2 above 45 mm Hg.
Failure to Correctly Place an Artificial Airway
The biggest indicator of a misplaced artificial airway is a waveform with a wiggly or irregular alveolar plateau. The wiggling indicates that one lung, usually the right lung, is ventilating before the other. This could be due to supraglottic placement, a leaking cuff, or an endotracheal tube in the right bronchus mainstem.
Cardiac Arrest and Spontaneous Return of Circulation
Capnography can prove valuable even when you aren’t actively ventilating a non-breathing patient. During CPR, you can use it as a reliable indicator of compression quality. It also notifies you when spontaneous circulation has resumed.
A good chest compression will appear as an EtCO2 of at least 10 mm Hg on a waveform. Pressures below this indicate that the person giving compressions is likely tired and needs to switch out with their partner. Alternatively, the patient has already been deceased for too long and CPR is ineffective.
If the end-tidal CO2 suddenly jumps above 45 mm Hg, it indicates a return of spontaneous circulation. When the heart begins pumping, it releases the large amounts of carbon dioxide that built up as a result of poor perfusion.
The Curare Cleft
If you’re monitoring a patient on full ventilation through an endotracheal tube, you’ll need to keep an eye out for curare clefts on the waveform. These slight dips near the end of the plateau are a sign that your patient is trying to breathe on their own, out of sync with the ventilator.
You only have a matter of minutes to re-administer a neuromuscular blockade once a curare cleft appears. Otherwise, the patient will no longer remain under anesthesia.
Interpreting Capnography Readings with the Cleo Monitor
Sometimes the most difficult part of capnography is using a clunky, outdated machine. Not so with the Cleo system. This sidestream capnography monitor is both mobile and intuitive, making it perfect for field and stationary environments alike.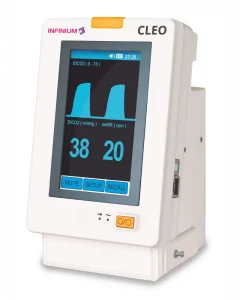
This lightweight monitor can serve as a stand-alone touchscreen capnograph. It also has accessory capabilities that enable it to record non-invasive blood pressure, SpO2, and rapid temperature if desired. You can use it as a spot-check pulse oximeter or clamp it to a bed rail/IV pole for long-term multi-system monitoring.
The Cleo monitor provides reliable, easy-to-read waveforms for both free-breathing and intubated patients. The EtCO2 waveform is displayed at the top of the screen with other vitals shown clearly below. Once you’ve learned how to interpret capnography waveforms, you’ll be able to gather all the necessary information about your patient with only a glance.
Learn the Vital Skill of Interpreting Capnography Waveforms
Whether you’re an EMS professional or provide patient care in a hospital, understanding how to read and interpret capnography waveforms is crucial. Both the EtCO2 value and waveform pattern give you vital information about your patient’s airway, ventilation, and perfusion.
Looking for more information on capnography skills and end-tidal CO2 device innovation? Review our capnography archives.